A dotplot of the number of tornadoes each year in a certain county from 1948 to 2004 is given.Each dot represents a year in which there were that many tornadoes. 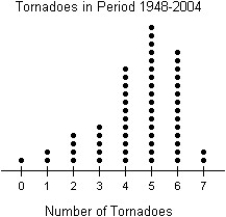
A) The distribution of the number of tornadoes per year is unimodal and symmetric,with a centre around 5 tornadoes per year.The number of tornadoes per year ranges from 0 to 7.
B) The distribution of the number of tornadoes per year is unimodal and skewed to the left,with a centre around 3.5 tornadoes per year.The number of tornadoes per year ranges from 0 to 7.
C) The distribution of the number of tornadoes per year is unimodal and symmetric,with a centre around 3.5 tornadoes per year.The number of tornadoes per year ranges from 0 to 7.
D) The distribution of the number of tornadoes per year is unimodal and skewed to the left,with a centre around 5 tornadoes per year.The number of tornadoes per year ranges from 0 to 7.
E) The distribution of the number of tornadoes per year is unimodal and skewed to the right,with a centre around 5 tornadoes per year.The number of tornadoes per year ranges from 0 to 7.
Correct Answer:
Verified
Q64: The mathematics department at a Canadian university
Q65: In a college health course,65 students participated
Q66: The diastolic blood pressures,in mm Hg,for a
Q67: The data below represent the midterm grades
Q68: In a survey,26 voters were asked their
Q70: A student at a local university took
Q71: The stem-and-leaf diagram shows the ages of
Q72: The diastolic blood pressures,in mm Hg,for a
Q73: The weights,in kilograms,of the members of the
Q74: Three statistics classes (50 students each)took the
Unlock this Answer For Free Now!
View this answer and more for free by performing one of the following actions

Scan the QR code to install the App and get 2 free unlocks

Unlock quizzes for free by uploading documents