The following table shows some costs and prices faced by a company that produces submarines.
Table 7.3 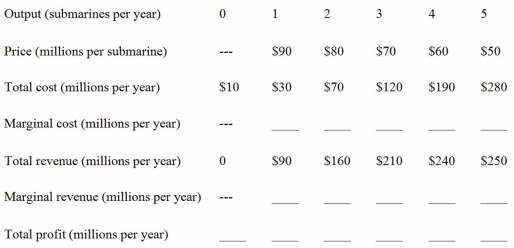
-In Table 7.3,profit maximization is achieved at a production rate of:
A) 1 submarine per year.
B) 3 submarines per year.
C) 4 submarines per year.
D) 5 submarines per year.
Correct Answer:
Verified
Q79: Which market structure is characterized by a
Q80: Which of the following is an advantage
Q81: Table 7.2-Monopoly costs and revenue 
Q82: The following table shows some costs and
Q83: If you want to fly to Los
Q85: The following table shows some costs and
Q86: The following table shows some costs and
Q87: Figure 7.1: Q88: Table 7.2-Monopoly costs and revenue Q89: Figure 7.1: ![]()
![]()
Unlock this Answer For Free Now!
View this answer and more for free by performing one of the following actions

Scan the QR code to install the App and get 2 free unlocks

Unlock quizzes for free by uploading documents