Electrostatic potential maps use color to portray the calculated electron distribution in a molecule.Atoms that are electron poor and carry a δ+ charge are shown in blue.Atoms that are electron rich and carry a δ- charge are shown in red.Atoms with little or no charge are shown in green.The electrostatic potential map of CH3Li below should show 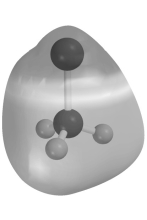
A) C blue and Li red.
B) C blue and Li green.
C) C green and Li blue.
D) C red and Li blue.
Correct Answer:
Verified
Q85: What geometric arrangement of charge clouds is
Q98: What is geometry around the carbon atom
Q104: How many lone pairs of electrons are
Q106: How many lone pairs are on the
Q174: Which drawing represents a π bonding molecular
Q175: What is the hybridization of the oxygen
Q176: What is the hybridization of the nitrogen
Q177: What is the hybridization of the oxygen
Q178: Which drawing represents a σ bonding molecular
Q184: Which of the following contains an atom
Unlock this Answer For Free Now!
View this answer and more for free by performing one of the following actions

Scan the QR code to install the App and get 2 free unlocks

Unlock quizzes for free by uploading documents