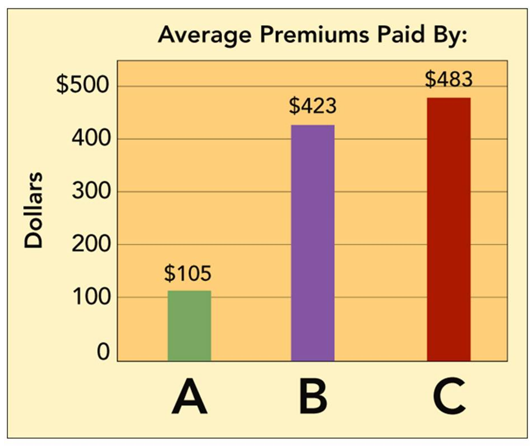
Flexible Pricing Chart
-Consider the flexible pricing chart above, which shows the results of a National Bureau of Economic Research study of 750,000 car purchases. The data indicate that some groups of car buyers, on average, paid roughly $105, $423, and $483 respectively for a new car in the $21,000 range than the typical purchaser. Who are the car buyers in column A?
A) women
B) the elderly
C) Hispanics
D) African Americans
E) Asian Americans
Correct Answer:
Verified
Q239: What do 60 percent of prospective buyers
Q270: Price discrimination is illegal under the
A) Sherman
Q279: Controlling agreements between independent buyers and sellers
Q283: Predatory pricing is
A) most effective in the
Q309: Setting one price for all buyers of
Q321: Marketers using a flexible-price policy should take
Q322: Yield management pricing is a form of
A)target
Q324: Setting different prices for products and depending
Q327: Family Dollar Stores, Dollar Value Stores, and
Q328: When you buy a used car from
Unlock this Answer For Free Now!
View this answer and more for free by performing one of the following actions

Scan the QR code to install the App and get 2 free unlocks

Unlock quizzes for free by uploading documents