In its 2000 report,a company presented the following data regarding its sales (in millions of dollars),and net income (in millions of dollars). 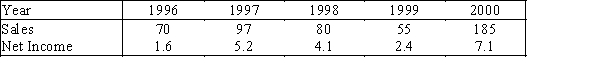 The bar chart below was used to present these data.
 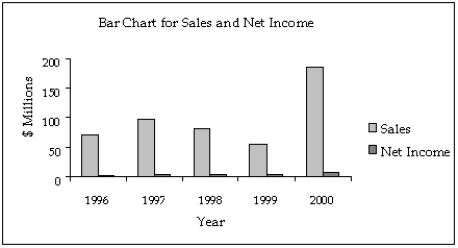 Assume that you are an unscrupulous statistician and want to make the data appear more positive than they really are.Redraw the graph by being selective about which years to include,getting the desired effect.
Correct Answer:
Verified
View Answer
Unlock this answer now
Get Access to more Verified Answers free of charge
Q144: An online dating service has a quick
Q145: Below are two line charts where the
Q146: Home Care Data are collected on
Q147: Briefly explain why the histogram below is
Q148: Credit Hours The College of Business at
Q150: Home Care Data are collected on
Unlock this Answer For Free Now!
View this answer and more for free by performing one of the following actions

Scan the QR code to install the App and get 2 free unlocks

Unlock quizzes for free by uploading documents