The following figure shows the demand curve and the marginal revenue curve of a monopolist.On the horizontal axis,OG = GF.
Figure 11-5 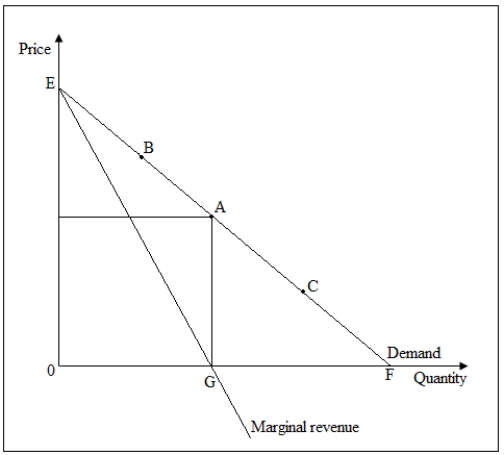
-Refer to Figure 11-5.A fall in price will decrease total revenue _____.
A) between the points E and F
B) between the points E and A
C) between the points A and F
D) at point G
Correct Answer:
Verified
Q46: A monopoly firm will operate on the:
A)elastic
Q50: Which of the following statements correctly identifies
Q51: A profit-maximizing monopolist will maximize both total
Q57: An important difference between a monopoly and
Q59: The following figure shows the demand curve
Q65: The following figure shows the demand curve
Q66: All of the following are sources of
Q66: The following figure shows the demand curve
Q70: Which of the following statements about the
Q72: A profit-maximizing monopolist will produce at a
Unlock this Answer For Free Now!
View this answer and more for free by performing one of the following actions

Scan the QR code to install the App and get 2 free unlocks

Unlock quizzes for free by uploading documents