Figure 7-1 shows the total product curve for different levels of a variable input,labor.
Figure 7-1 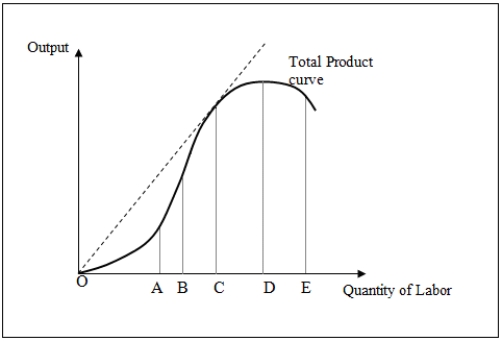
-In Figure 7-1,marginal product of labor is positive but lesser than the average product of labor after point _____.
A) A
B) B
C) C
D) D
Correct Answer:
Verified
Q22: Figure 7-1 shows the total product curve
Q25: If the marginal product of a variable
Q26: Figure 7-2 shows the total product curve
Q27: The average product of labor at a
Q30: Figure 7-2 shows the total product curve
Q31: When the total product curve with only
Q31: Table 7-4 shows the quantities of
Q35: If total product is increasing at a
Q36: When marginal product is decreasing:
A)average product must
Q39: The slope of the total product curve
Unlock this Answer For Free Now!
View this answer and more for free by performing one of the following actions

Scan the QR code to install the App and get 2 free unlocks

Unlock quizzes for free by uploading documents