refer to the following graph: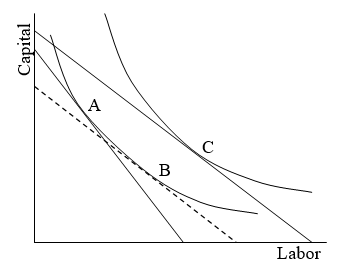
-(appendix) If the two isoquants represent profit maximizing levels of output for two different wage rates,the move from point A to point B represents the:
A) output effect of a reduction in the wage
B) output effect of an increase in the wage
C) substitution effect of a reduction in the wage
D) substitution effect of an increase in the wage
Correct Answer:
Verified
Q54: The market wage increases from $9 to
Q55: Suppose that,as a result of an increase
Q56: (appendix)An isoquant shows all combinations of:
A)wage rates
Q57: (appendix)At the least-cost combination of capital and
Q58: In his comparison of over 100 studies
Q59: Which of the following can be predicted
Q60: International trade:
A)increases labor demand in some industries
Q61: (appendix)If the marginal rate of technical substitution
Q62: (appendix)The slope of an isoquant at any
Q64: ![]()
Unlock this Answer For Free Now!
View this answer and more for free by performing one of the following actions

Scan the QR code to install the App and get 2 free unlocks

Unlock quizzes for free by uploading documents