The following graph depicts demand. 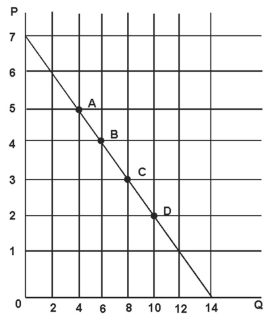
Refer to the figure above.The price elasticity of demand at point A is:
A) 5/2.
B) 5/8.
C) 2/5.
D) 8/5.
Correct Answer:
Verified
Q41: If the quantity demanded of a good
Q43: If the slope of the demand curve
Q46: Economists have found that the price elasticity
Q50: The following graph depicts demand. 
Q50: Suppose that the short run price elasticity
Q51: Price elasticity of demand is _ the
Q54: Demand tends to be _ in the
Q56: The following graph depicts demand.
Q57: If the slope of the demand curve
Q59: The reason a brand name item (e.g.
Unlock this Answer For Free Now!
View this answer and more for free by performing one of the following actions

Scan the QR code to install the App and get 2 free unlocks

Unlock quizzes for free by uploading documents