The distribution pictured below is: 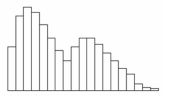
A) bimodal and skewed right.
B) bimodal and skewed left.
C) skewed right.
D) skewed left.
Correct Answer:
Verified
Q72: This histogram shows Chris's golf scores in
Q73: To classify prices from 62 recent home
Q74: Which is not revealed on a scatter
Q75: If you have 32 data points, how
Q76: Below is a frequency distribution of
Q78: Which is a characteristic of a histogram's
Q79: If you have 256 data points, how
Q80: Bob found an error in the
Q81: A population has 75 observations. One class
Q82: A population is of size 5,500 observations.
Unlock this Answer For Free Now!
View this answer and more for free by performing one of the following actions

Scan the QR code to install the App and get 2 free unlocks

Unlock quizzes for free by uploading documents