The following graph is a ________. 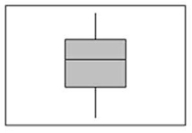
A) dot plot
B) stem-and-leaf display
C) box plot
D) contingency table
Correct Answer:
Verified
Q16: A dot plot is useful for showing
Q17: A dot plot shows the symmetry of
Q18: A dot plot is an easy way
Q19: A scatter diagram is used to illustrate
Q20: A dot plot is useful for showing
Q22: The following graph is a _.
Q23: The interquartile range is graphically presented in
Q24: What does the interquartile range describe?
A)The range
Q25: A box plot shows _.
A)the mean and
Q26: In a stem-and-leaf display,the leaf represents a
Unlock this Answer For Free Now!
View this answer and more for free by performing one of the following actions

Scan the QR code to install the App and get 2 free unlocks

Unlock quizzes for free by uploading documents