The table below shows hypothetical data for the volume of gold and nickel output across several years.
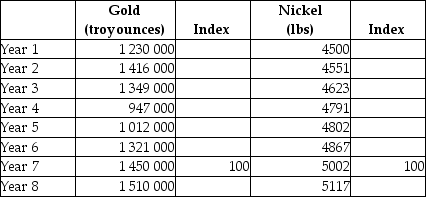 TABLE 2-6
-Refer to Table 2-6.What is the percentage change in gold output from Year 1 to Year 7?
A) 17.9%
B) 84.8%
C) 15.2%
D) -15.2%
E) 0.152%
Correct Answer:
Verified
Q75: The table below shows hypothetical prices for
Q76: The table below shows hypothetical data for
Q77: The table below shows hypothetical prices for
Q78: The table below shows hypothetical data for
Q79: The table below shows hypothetical data for
Q82: The table below shows the approximate value
Q82: Consider the following equation: Y = 10
Q83: The table below shows the approximate value
Q88: Data collected of several variables but for
Q89: An economist has data showing household income
Unlock this Answer For Free Now!
View this answer and more for free by performing one of the following actions

Scan the QR code to install the App and get 2 free unlocks

Unlock quizzes for free by uploading documents