Use the information contained in the attached chart to determine your answer. Twenty samples of size 8 were taken from a stable process.From past studies of the process, you know that the overall mean is 42.5 and that the average of the samples range is 2.0.What is the upper control limit for the x-bar chart?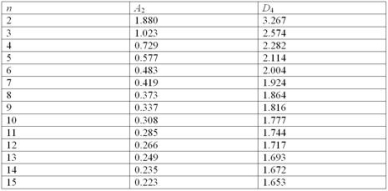
A) 43.25
B) 44.50
C) 46.22
D) 48.50
Correct Answer:
Verified
Q22: Which of the following quality improvement tools
Q26: Under what conditions would we be required
Q29: Fifteen samples of size 10 are taken
Q31: Which of the following conclusions does the
Q31: Which of the following conclusions does the
Q32: You are given the following data for
Q34: You are given the following data for
Q35: Forty samples of 100 are taken,with the
Q36: A process can be said to be
Q40: Which of the following types of control
Unlock this Answer For Free Now!
View this answer and more for free by performing one of the following actions

Scan the QR code to install the App and get 2 free unlocks

Unlock quizzes for free by uploading documents