At each of the three points in the following graph,indicate whether planned aggregate expenditure is greater than,equal to,or less than GDP. 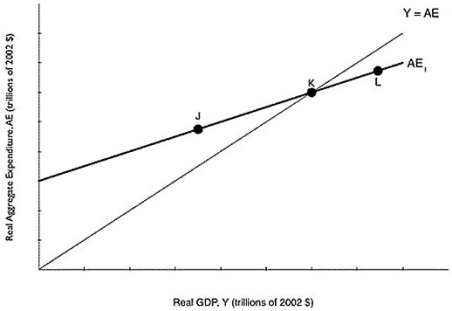 Alt text for Question 47: For question 47,a graph comparing planned aggregate expenditure and GDP.
Long description for Question 47: The x-axis is labelled,real GDP,Y (trillions of 2002 dollars).The y-axis is labelled,real aggregate expenditure,AE (trillions of 2002 dollars).Line Y = AE originates at the vertex and slopes up to the top right corner.Line AE1,begins a little less than half way along the x-axis and slopes up to the end of the x-axis.Both lines intersect at point K,approximately 3 quarters of the way along both lines.Point J is plotted a little less than half way along line AE1,to the left of point K.Point L is plotted close to the right end of line AE1,to the right of point K.
Correct Answer:
Verified
View Answer
Unlock this answer now
Get Access to more Verified Answers free of charge
Q204: Figure 8.4 Q206: What is the macroeconomic consequence if firms Q206: Figure 8.4 Q208: Figure 8.3 Q211: Table 8.11 Q216: _ is equal to consumption spending plus Q216: If planned aggregate expenditure equals GDP,the economy Q217: Which of the following leads to a Q223: Figure 8.5 Q240: In the aggregate expenditure model, _ has Unlock this Answer For Free Now! View this answer and more for free by performing one of the following actions Scan the QR code to install the App and get 2 free unlocks Unlock quizzes for free by uploading documents![]()
![]()
![]()
![]()
![]()

