Using the points on the diagram below,identify which combinations of these points illustrate diminishing returns to capital.Give a brief explanation to support your answer. 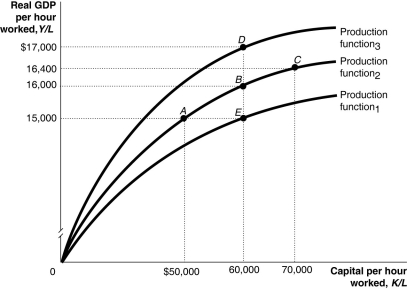 Alt text for Question 101: For question 101,a graph illustrating diminishing returns to capital
Long description for Question 101: The x-axis is labelled,capital per hour worked,K/L.The y-axis is labelled,real GDP per hour worked,Y/L.3 concave curves originating from 0 at the vertex are shown.5 points A ($50000,15000),B (60000,16000),C (70000,16400),D (60000,$17000),and E (60000,15000)are plotted.The curve labelled,Production function 1,passes through point E.The curve labelled,Production function 2,passes through points A,B,and C.The curve labelled,Production function 3,passes through point D.These 5 points are connected to their respective coordinates on the x and y-axis with dotted lines.
Correct Answer:
Verified
View Answer
Unlock this answer now
Get Access to more Verified Answers free of charge
Q127: According to the text, there are three

