Multiple Choice
The following graph is a 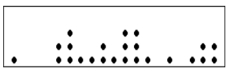
A) Dot plot
B) Stem-and-leaf diagram
C) Box plot
D) Contingency table
Correct Answer:
Verified
Related Questions
Q11: A relationship between two nominal variables is
Q21: In a distribution, the second quartile corresponds
Q30: A relationship between gender and preference for
Q31: In the following set of data, what
Q32: A dot plot is best applied for
Q34: To locate the percentile for a given
Unlock this Answer For Free Now!
View this answer and more for free by performing one of the following actions

Scan the QR code to install the App and get 2 free unlocks

Unlock quizzes for free by uploading documents