Six Sigma is one approach for setting quality expectations for a given process or output. As pointed out in Chapter 17 of your text, the term "Six Sigma" comes from statistics: in a normal distribution, the area (probability) outside of +/− six (6) standard deviations from the mean value is exceedingly small. You are provided the following values from a standardized normal distribution (i.e., a distribution with a mean of zero and a standard deviation of 1.0): Note: The Z values in the above table refer to the number of sigmas to the right of center (i.e., to the right of Z = 0). The listed probabilities, p, refer to the area to the right of the chosen Z point, as illustrated by the graph below: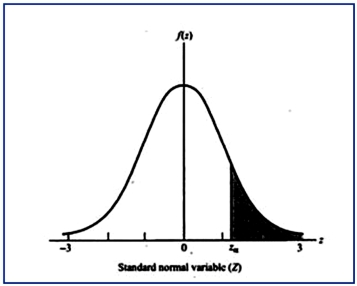 Required:
1. Given the above, what is the total probability (area under the curve) corresponding to Z = 0 +/− 1.0 sigma, rounded to two decimal places (e.g., 0.34817 = 34.82%)? How many units (out of 1,000 outputs) would have one or more defects for a process operating at one-sigma performance level? Round your answer to nearest whole number.
2. What is the total probability (area under the curve) corresponding to Z = 0 +/− 3.0 sigma, rounded to two decimal places? How many units (out of 1,000 outputs) would have one or more defects for a process operating at three-sigma performance level? Round your answer to nearest whole number.
3. Under a four-sigma control level, what is the total area in the two tails of the distribution, rounded to six (6) decimal places (e.g., 0.00004169 = 0.00417%). What is the total probability (area under the curve) corresponding to Z = 0 +/− 4.0 sigma, rounded to two decimal places? How many units (out of 100,000 outputs) would have one or more defects for a process operating at four-sigma performance level? Round your answer to nearest whole number.
4. What general conclusion can you draw based on the preceding results?
Correct Answer:
Verified
View Answer
Unlock this answer now
Get Access to more Verified Answers free of charge
Q133: Pandra Manufacturing specifies the quality characteristic of
Q134: In an effort to improve its competitive
Q135: The Old Army Jean Company has been
Q136: White Financial Services Corporation is engaged in
Q137: One of the concerns with moving to
Q139: Turbo-Oven, Inc. is considering a move to
Q140: A Cost-of-Quality (COQ) reporting format may be
Q141: Because of the need to improve its
Q142: Provide four reasons why both internal and
Q143: As noted in the text, a comprehensive
Unlock this Answer For Free Now!
View this answer and more for free by performing one of the following actions

Scan the QR code to install the App and get 2 free unlocks

Unlock quizzes for free by uploading documents