Refer to Figure 7.2.Which of the following statements is true? 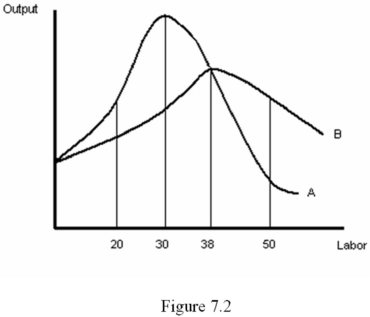
A) The curve labeled A represents the APL.
B) Curves A and B represent short-run production functions.
C) The curve labeled A represents the MPL.
D) The curve labeled B represents the MPL.
Correct Answer:
Verified
Q34: Refer to Figure 7.1.What is the average
Q35: Which of the following is the formula
Q36: _ are resources that are fully used
Q37: Suppose a manager is deciding how to
Q38: Refer to Figure 7.3.Suppose a firm moves
Q40: Refer to Figure 7.2.With which worker does
Q41: One reason that firms will experience decreasing
Q42: With _ returns to scale,production is most
Q43: Suppose a firm uses only capital and
Q44: Refer to Figure 7.5.Which diagram represents isoquants
Unlock this Answer For Free Now!
View this answer and more for free by performing one of the following actions

Scan the QR code to install the App and get 2 free unlocks

Unlock quizzes for free by uploading documents