In the figure below, a shift in the budget line from AC to BC represents: 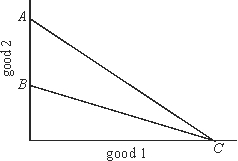
A) a decrease in income.
B) an increase in good 2's price.
C) an increase in good 1's price.
D) a decrease in good 2's price.
E) a decrease in good 1's price.
Correct Answer:
Verified
Q8: In the figure below, a rise in
Q9: Increasing all prices and income in exactly
Q10: In the figure below, if the consumer
Q11: A purpose of indifference-curve analysis is to:
A)derive
Q12: The equilibrium condition for the consumer is
Q14: An indifference curve is bowed out like
Q15: Consumer equilibrium on an indifference map is
Q16: As shown in the figure below a
Q17: Which of the following statements concerning indifference
Q18: Indifference curves are generally convex to the
Unlock this Answer For Free Now!
View this answer and more for free by performing one of the following actions

Scan the QR code to install the App and get 2 free unlocks

Unlock quizzes for free by uploading documents