Figure 10.11 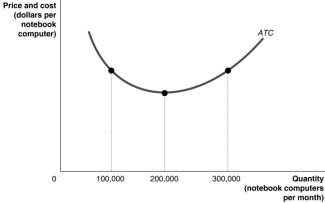
-Refer to Figure 10.11.Suppose the above graph represents the relationship between the average total cost of producing notebook computers and the quantity of notebook computers produced by Dell.On a graph, illustrate the demand, MR, MC, and ATC curves which would represent Dell maximising profits at a quantity of 100 000 per month and identify the area on the graph which represents the profit.
__________________________________________________________________________________________________________________________________________________________________________________________
Correct Answer:
Verified
Q104: Figure 10.9 Q106: Assume that price exceeds average variable cost Q109: A profit-maximising monopolistically competitive firm produces and Q110: Figure 10.8 Q111: For a profit-maximising monopolistically competitive firm, for Q112: Consumers in a monopolistically competitive market do Q132: You have just opened a new Italian Q134: You are planning to open a new Q136: A monopolistically competitive firm that is earning Q138: In the long run, if price is![]()
![]()
Unlock this Answer For Free Now!
View this answer and more for free by performing one of the following actions

Scan the QR code to install the App and get 2 free unlocks

Unlock quizzes for free by uploading documents