Multiple Choice
Figure 5-12
The following figure shows the supply curve for a particular good. 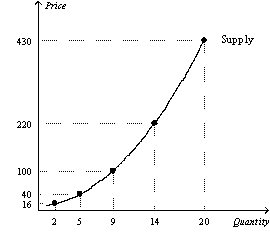
-Refer to Figure 5-12.Using the midpoint method,what is the price elasticity of supply between $16 and $40?
A) 0.125
B) 0.86
C) 1.0
D) 2.5
Correct Answer:
Verified
Related Questions
Q343: Figure 5-15 Q344: Figure 5-15 Q345: Figure 5-13 Q346: Table 5-6 Q347: Figure 5-13 Q349: At a price of $1.20,a local coffee Q350: Figure 5-13 Q351: At a price of $1.00,a local coffee Q352: Table 5-6 Q353: Figure 5-12 Unlock this Answer For Free Now! View this answer and more for free by performing one of the following actions Scan the QR code to install the App and get 2 free unlocks Unlock quizzes for free by uploading documents![]()
![]()
![]()
![]()
![]()
![]()
![]()
The following figure shows the supply

