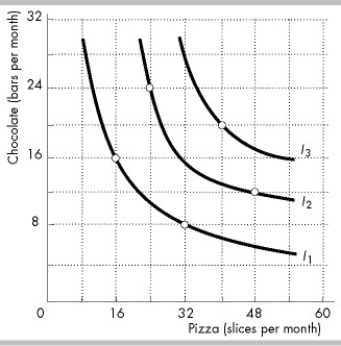
-The indifference curves in the figure above (I1, I2, and I3) reflect Peter's consumption preferences. Which of the following combinations of goods does Peter prefer the most?
A) 48 slices of pizza and 12 chocolate bars
B) 24 slices of pizza and 24 chocolate bars
C) 40 slices of pizza and 20 chocolate bars
D) 32 slices of pizza and 8 chocolate bars
Correct Answer:
Verified
Q208: Q209: The magnitude of the slope of an Q210: Q211: Q212: The marginal rate of substitution is equal Q214: The marginal rate of substitution is Q215: The rate at which a person is Q216: An indifference diagram has movies on the Q217: Q218: Unlock this Answer For Free Now! View this answer and more for free by performing one of the following actions Scan the QR code to install the App and get 2 free unlocks Unlock quizzes for free by uploading documents![]()
![]()
![]()
A) the![]()
![]()

