Figure 8.7 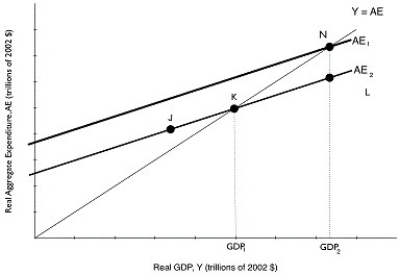 Alt text for Figure 8.7: In figure 8.7, a graph comparing real GDP and real aggregate expenditure.
Long description for Figure 8.7: The x-axis is labelled, real GDP, Y (trillions of 2002 dollars) .The y-axis is labelled, real aggregate expenditure, AE (trillions of 2002 dollars) .Line AE1, begins a little less than half way along the x-axis and slopes up to the end of the x-axis.Line AE2, is to the right of AE1 and is on a similar path as line AE1, sloping up to the top right corner.Line Y = AE, originates at the vertex and slopes up to the top right corner.Line Y = AE meets line AE2 at point K, half way along both the lines, and meets line AE1 at point N, plotted close to the right end of line AE1.Point J is plotted a little less than half way along line AE2, to the left of point K.Point L is marked close to the right end of line AE2, to the right of point K.
-Refer to Figure 8.7.Suppose that investment spending decreases by $5 million, decreasing aggregate expenditure and decreasing real GDP from GDP2 to GDP1.If the MPC is 0.8, then what is the change in GDP?
A) -$4 million
B) -$5 million
C) -$25 million
D) -$40 million
E) -$50 million
Correct Answer:
Verified
Q245: Figure 8.7 Q246: Assume proponents of public funding for a Q247: If an increase in autonomous consumption spending Q248: In 2007-2008, exports from Canada to the Q249: Economists think that the marginal propensity to Q251: All of the following are true statements![]()
Unlock this Answer For Free Now!
View this answer and more for free by performing one of the following actions

Scan the QR code to install the App and get 2 free unlocks

Unlock quizzes for free by uploading documents