Figure 8.6 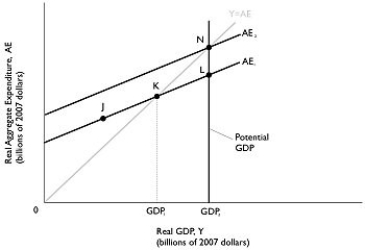 Alt text for Figure 8.6: In figure 8.6, a graph depicting potential GDP.
Long description for Figure 8.6: The x-axis is labelled, real GDP, Y (billions of 2007 dollars) , with values GDP1 and GDP2 marked.The y-axis is labelled, real aggregate expenditure, AE (billions of 2007 dollars) .Line AE1, begins a little less than half way along the x-axis and slopes up to the end of the x-axis.Line AE2, begins at a point half way along the x-axis and slopes up to the top right corner.Line AE2 is to the left of AE1 and is on a similar path as line AE1.Line Y = AE, originates at the vertex and slopes up to the top right corner.Line Y = AE meets line AE1 at point K, half way along both lines.Line Y = AE meets line AE2 at point N, plotted close to the right end of line AE2.Point J is plotted a little less than half way along line AE1, to the left of point K.Point L is plotted close to the right end of line AE1, to the right of point K.Point K is connected to its x-coordinate, GDP1, with a dotted line.A straight line, representing potential GDP, is drawn joining points N and L with their x-coordinate, GDP2, such that it is parallel to the point K to GDP1 with a dotted line.
-Refer to Figure 8.6.Potential GDP equals $100 billion.The economy is currently producing GDP1 which is equal to $90 billion.If the MPC is 0.8, then how much must autonomous spending change for the economy to move to potential GDP?
A) -$18 billion
B) -$2 billion
C) $2 billion
D) $18 billion
Correct Answer:
Verified
Q223: Figure 8.5 Q224: If an increase in autonomous consumption spending Q226: Figure 8.5 Q229: John Maynard Keynes argued that if many Q231: Which of the following is a true Q232: The multiplier is calculated as the Q243: If the multiplier is 5,the marginal propensity Q245: If the marginal propensity to save is Q250: Discuss the leading causes of the Great Q256: The larger the MPC,the smaller the value![]()
![]()
A)change in
Unlock this Answer For Free Now!
View this answer and more for free by performing one of the following actions

Scan the QR code to install the App and get 2 free unlocks

Unlock quizzes for free by uploading documents