At each of the three points in the following graph, indicate whether planned aggregate expenditure is greater than, equal to, or less than GDP. 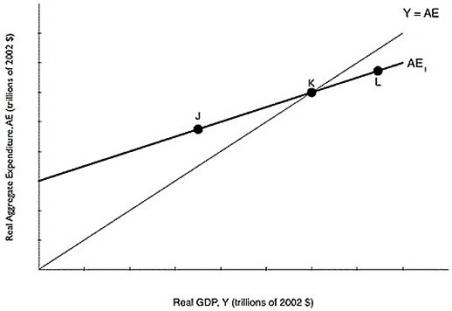 Alt text for Question 47: For question 47, a graph comparing planned aggregate expenditure and GDP.
Long description for Question 47: The x-axis is labelled, real GDP, Y (trillions of 2002 dollars).The y-axis is labelled, real aggregate expenditure, AE (trillions of 2002 dollars).Line Y = AE originates at the vertex and slopes up to the top right corner.Line AE1, begins a little less than half way along the x-axis and slopes up to the end of the x-axis.Both lines intersect at point K, approximately 3 quarters of the way along both lines.Point J is plotted a little less than half way along line AE1, to the left of point K.Point L is plotted close to the right end of line AE1, to the right of point K.
Correct Answer:
Verified
View Answer
Unlock this answer now
Get Access to more Verified Answers free of charge

