Figure 8.3 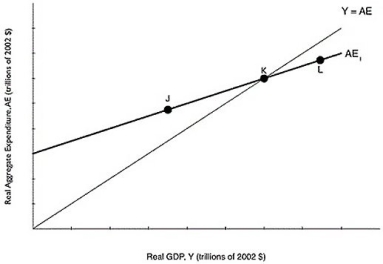 Alt text for Figure 8.3: In figure 8.3, a graph comparing real GDP and real aggregate expenditure.
Long description for Figure 8.3: The x-axis is labelled, real GDP, Y (trillions of 2002 dollars) .The y-axis is labelled, real aggregate expenditure, AE (trillions of 2002 dollars) .Line Y = AE, originates at the vertex and slopes up to the top right corner.Line AE1, begins a little less than half way along the x-axis and slopes up to the end of the x-axis.Both these lines intersect at point K, approximately 3 quarters of the way along both lines.Point J is plotted a little less than half way along line AE1, to the left of point K.Point L is marked close to the right end of the line AE1, to the right of point K.
-Refer to Figure 8.3.If the economy is at point J, what will happen?
A) Inventories have fallen below their desired level, so firms will decrease production.
B) Inventories have fallen below their desired level, so firms will increase production.
C) Inventories have risen above their desired level, so firms will decrease production.
D) Inventories have risen above their desired level, so firms will increase production.
Correct Answer:
Verified
Q214: If planned aggregate expenditure is above potential
Q215: Figure 8.4 Q216: _ is equal to consumption spending plus Q217: If planned aggregate expenditure is less than Q217: Which of the following leads to a Q220: If the economy is currently in equilibrium Q221: If an increase in investment spending of Q222: The ratio of the increase in _ Q223: Figure 8.5 Q224: If an increase in autonomous consumption spending![]()
![]()
Unlock this Answer For Free Now!
View this answer and more for free by performing one of the following actions

Scan the QR code to install the App and get 2 free unlocks

Unlock quizzes for free by uploading documents