Figure 8.1 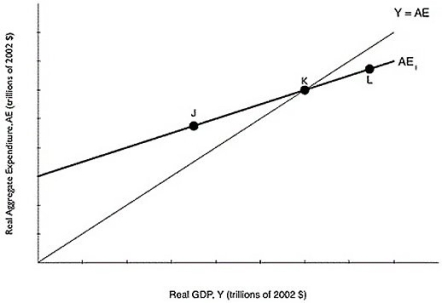 Alt text for Figure 8.1: In figure 8.1, a graph comparing real GDP and real aggregate expenditure.
Long description for Figure 8.1: The x-axis is labelled, real GDP, Y (trillions of 2002 dollars) .The y-axis is labelled, real aggregate expenditure, AE (trillions of 2002 dollars) .A line, labelled Y = AE, originates at the vertex and slopes up to the top right corner.Another line, labelled AE1, begins a little less than half way along the x-axis and slopes up to the end of the x-axis.Both these lines intersect at point K, approximately three quarters of the way along both lines.Point J is plotted a little less than half way along the line AE1, to the left of point K.Point L is plotted close to the right end of the line AE1, to the right of point K.
-Refer to Figure 8.1.If the economy is at a level of aggregate expenditure given by point K,
A) the economy is in equilibrium.
B) production is greater than spending.
C) production is less than spending.
D) inventories will increase above their desired level.
E) firms will have an incentive to increase production.
Correct Answer:
Verified
Q195: Figure 8.2 Q196: Assume you are given the following information Q198: Figure 8.2 Q199: Planned aggregate expenditure is equal to Q203: If planned aggregate expenditure is greater than Q204: For all points above the 45 degree Unlock this Answer For Free Now! View this answer and more for free by performing one of the following actions Scan the QR code to install the App and get 2 free unlocks Unlock quizzes for free by uploading documents![]()
![]()
A)consumption spending

