Using the points on the diagram below, identify which combinations of these points illustrate diminishing returns to capital.Give a brief explanation to support your answer. 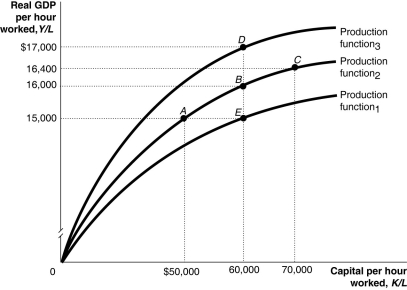 Alt text for Question 101: For question 101, a graph illustrating diminishing returns to capital
Long description for Question 101: The x-axis is labelled, capital per hour worked, K/L.The y-axis is labelled, real GDP per hour worked, Y/L.3 concave curves originating from 0 at the vertex are shown.5 points A ($50000, 15000), B (60000, 16000), C (70000, 16400), D (60000, $17000), and E (60000, 15000)are plotted.The curve labelled, Production function 1, passes through point E.The curve labelled, Production function 2, passes through points A, B, and C.The curve labelled, Production function 3, passes through point D.These 5 points are connected to their respective coordinates on the x and y-axis with dotted lines.
Correct Answer:
Verified
View Answer
Unlock this answer now
Get Access to more Verified Answers free of charge
Q57: The owner of a firm wants some
Q123: Your friend owns a snow cone stand
Q130: The Soviet Union's economic growth rate slowed
Q148: The "new economy" which some economists believe
Q149: Which of the following explains the ability
Q150: Growth in Canada from 1870 to 1970
Q152: The easiest way for a country to
Q154: Suggest two policies the federal government could
Q155: Economic growth optimists site which of the
Q156: Technological change allows the economy to produce
Unlock this Answer For Free Now!
View this answer and more for free by performing one of the following actions

Scan the QR code to install the App and get 2 free unlocks

Unlock quizzes for free by uploading documents