Starting at point B in the diagram below, identify which combinations of points illustrate technological change.Give a brief explanation to support your answer. 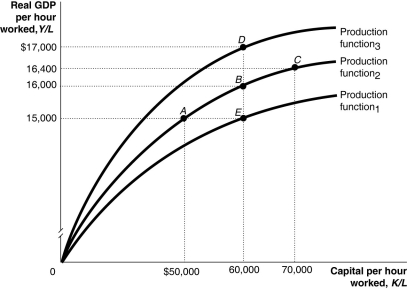 Alt text for Question 46: For question 46, a graph illustrating technological change.
Long description for Question 46: The x-axis is labelled, capital per hour worked, K/L.The y-axis is labelled, real GDP per hour worked, Y/L.3 concave curves originating from 0 at the vertex are shown.5 points, A ($50000, $15000), B ($60000, $16000), C ($70000, $16400), D ($60000, $17000), and E ($60000, $15000)are plotted.The curve labelled Production function 1, passes through point E.The curve labelled Production function 2, passes through points A, B, and C.The curve labeled Production function 3, passes through point D.The 5 points are connected to their respective coordinates on the x and y-axis with dotted lines.
Correct Answer:
Verified
View Answer
Unlock this answer now
Get Access to more Verified Answers free of charge
Q86: Which factors explain labour productivity?
A)technological change; the
Q87: A patent grants an inventor exclusive rights
Q91: According to Joseph Schumpeter, economic growth is
Q92: Why do some firms choose not to
Q94: An economic growth model
A)explains changes in nominal
Q95: Human capital refers to the percentage of
Q127: One drawback of the patent system is
Q134: Explain how market economies are generally better
Q137: Technological change is the key to sustaining
Q139: Is knowledge capital subject to the law
Unlock this Answer For Free Now!
View this answer and more for free by performing one of the following actions

Scan the QR code to install the App and get 2 free unlocks

Unlock quizzes for free by uploading documents