The figure given below shows three Short Run Average Total Cost (SRATC) curves and the Long Run Average Total Cost (LRATC) curve of a firm. Figure 7.3 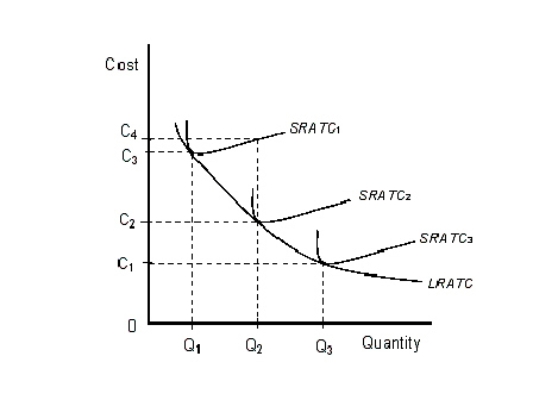
- Which of the following would account for the shape of the long-run average-total-cost curve in Figure 7.3?
A) Low worker morale
B) Low productivity
C) Administration overhead
D) Specialization of labor
E) Managerial problems
Correct Answer:
Verified
Q62: If long-run costs are plotted on the
Q65: The term minimum efficient scale means:
A)the output
Q68: The long-run average-total-cost curve is U-shaped because:
A)a
Q70: The figure given below shows three Short
Q71: The figure given below shows three Short
Q72: The table given below shows the average
Q74: The table given below shows the average
Q76: The table given below shows the average
Q77: The figure given below shows three Short
Q78: The table given below shows the average
Unlock this Answer For Free Now!
View this answer and more for free by performing one of the following actions

Scan the QR code to install the App and get 2 free unlocks

Unlock quizzes for free by uploading documents