From the following scatter plot, we can say that between Y and X there is ___. 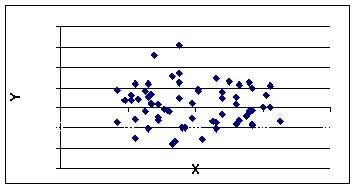
A) perfect positive correlation
B) virtually no correlation
C) positive correlation
D) negative correlation
E) perfect negative correlation
Correct Answer:
Verified
Q10: The first step in simple regression analysis
Q21: From the following scatter plot, we can
Q25: The standard error of the estimate, denoted
Q25: Prediction intervals get narrower as we extrapolate
Q27: According to the following graphic, X and
Q31: Regression output from Excel software includes an
Q34: The range of admissible values for the
Q40: The variability in the estimated slope is
Q61: In regression analysis, R-squared is also called
Q69: The numerical value of the coefficient of
Unlock this Answer For Free Now!
View this answer and more for free by performing one of the following actions

Scan the QR code to install the App and get 2 free unlocks

Unlock quizzes for free by uploading documents