Refer to the figure below. This graph describes a good that: 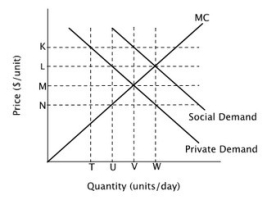
A) generates positive externalities.
B) should be banned.
C) generates negative externalities.
D) the government should tax.
Correct Answer:
Verified
Q85: If the government wants to increase economic
Q86: Refer to the figure below. At the
Q87: Refer to the figure below. The socially
Q88: Refer to the figure below. The socially
Q89: Refer to the figure below. In this
Q91: When the government imposes a tax on
Q92: The tendency for a resource that has
Q93: Refer to the figure below. The socially
Q94: Refer to the figure below. Private incentives
Q95: Suppose that a vaccine is developed for
Unlock this Answer For Free Now!
View this answer and more for free by performing one of the following actions

Scan the QR code to install the App and get 2 free unlocks

Unlock quizzes for free by uploading documents