Which of the bar graphs in the figure below depicts data regarding a beneficial mutation that will become fixed most rapidly? 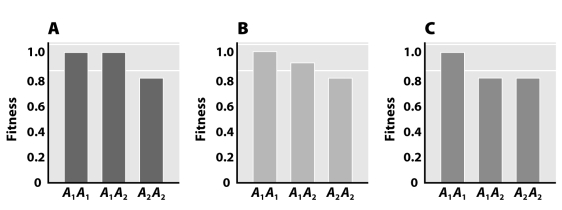
A) Graph A
B) Graph B
C) Graph C
D) Cannot be determined from the information provided
E) None of the above
Correct Answer:
Verified
Q13: The selection coefficient describes
A)the value of an
Q14: Which of the following model organisms is
Q15: If no evolutionary force acts on a
Q16: The null model for population genetics is
A)Newton's
Q17: Consider a diploid population in which a
Q19: Assume a biallelic locus in a diploid
Q20: When a population is in a neutral
Q21: Lifetime fitness,as demonstrated by Cummings et al.'s
Q22: Consider a sample of 100 individuals sampled
Q23: In the following figure,m is the mutation
Unlock this Answer For Free Now!
View this answer and more for free by performing one of the following actions

Scan the QR code to install the App and get 2 free unlocks

Unlock quizzes for free by uploading documents