THE NEXT QUESTIONS ARE BASED ON THE FOLLOWING INFORMATION:
From the top 1000 companies in valuation,a comparison of the mean dividend yield of the top and bottom ten electric utility companies is desired.Let 1 = top ten,and 2 = bottom ten,electric utility companies respectively.The data shown below are for two independent samples,which are drawn at random from populations that are normally distributed.
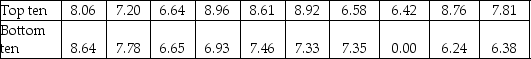
-Using results of Excel or Minitab to conduct a two-sample t-test for data in the table above,test
H0 : μ1 - μ2 = 0 vs.H1 : μ1 - μ2 ≠ 0 at the 5% significance level.What is your conclusion?
Correct Answer:
Verified
View Answer
Unlock this answer now
Get Access to more Verified Answers free of charge
Q93: THE NEXT QUESTIONS ARE BASED ON THE
Q94: THE NEXT QUESTIONS ARE BASED ON THE
Q95: THE NEXT QUESTIONS ARE BASED ON THE
Q96: THE NEXT QUESTIONS ARE BASED ON THE
Q97: A production manager is interested in comparing
Q98: THE NEXT QUESTIONS ARE BASED ON THE
Q99: THE NEXT QUESTIONS ARE BASED ON THE
Q101: THE NEXT QUESTIONS ARE BASED ON THE
Q102: THE NEXT QUESTIONS ARE BASED ON THE
Q103: THE NEXT QUESTIONS ARE BASED ON THE
Unlock this Answer For Free Now!
View this answer and more for free by performing one of the following actions

Scan the QR code to install the App and get 2 free unlocks

Unlock quizzes for free by uploading documents