The data in the time-series plot below represents monthly sales for two years of beanbag animals at a local retail store (Month 1 represents January and Month 12 represents December).Do you see any obvious patterns in the data? Explain. 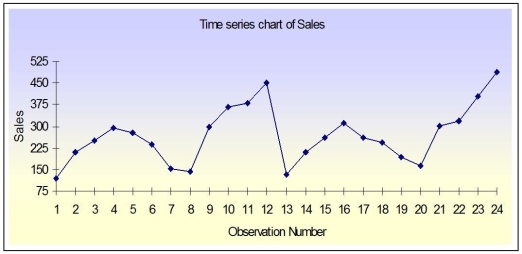
Correct Answer:
Verified
View Answer
Unlock this answer now
Get Access to more Verified Answers free of charge
Q237: Of those in the sample who went
Q238: If you want to be 80% sure
Q239: A consumer goods company has been studying
Q240: What percentage of the students in the
Q241: Discuss how a histogram can be constructed
Q243: The 2005 mobile phone manufacturers' global market
Q244: Identify the shape of the distribution of
Q245: Describe systematic sampling.Use a sample size of
Q246: Using the Cross Table below,construct a Component
Q247: Briefly describe sampling and nonsampling errors.
Unlock this Answer For Free Now!
View this answer and more for free by performing one of the following actions

Scan the QR code to install the App and get 2 free unlocks

Unlock quizzes for free by uploading documents