Refer to Figure 14.3 for the next several questions.
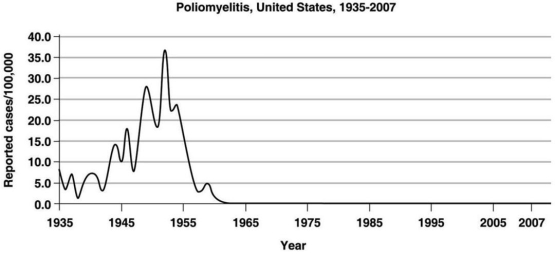
-The graph in Figure 14.3 shows the incidence of polio in the United States.The period between 1945 and 1955 indicates a(n)
A) endemic level.
B) epidemic level.
C) sporadic infection.
D) communicable disease.
E) pandemic.
Correct Answer:
Verified
Q39: In which of the following patterns of
Q40: A cold transmitted by a facial tissue
Q41: Pseudomonas bacteria colonized the bile duct of
Q42: MMWR is a publication by the CDC
Q43: The yeast Candida albicans does NOT normally
Q45: Interpreting this graph,can we conclude that polio
Q46: If a prodromal period exists for a
Q47: Which of the following statements is FALSE?
A)Antimicrobial
Q48: Bloodstream infections are the least common forms
Q49: Which of the following is NOT an
Unlock this Answer For Free Now!
View this answer and more for free by performing one of the following actions

Scan the QR code to install the App and get 2 free unlocks

Unlock quizzes for free by uploading documents