Multiple Choice
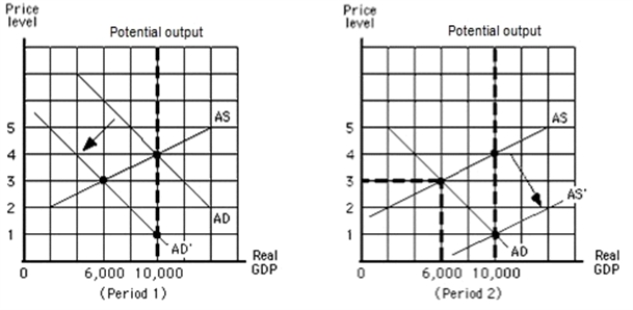
-Refer to the graphs in the exhibit.From the beginning of period 1 to the end of period 2, what happened to real GDP?
A) It increased from $6,000 to $10,000 and stayed there.
B) It decreased from $10,000 to $6,000 and stayed there.
C) It decreased from $10,000 to $,6,000 in period 1, and it increased from $6,000 to $10,000 in period 2.
D) It increased from $6,000 to $10,000 in period 1, and it decreased from $10,000 to $6,000 in period 2.
Correct Answer:
Verified
Related Questions
Q71: On an aggregate demand and aggregate supply

