Multiple Choice
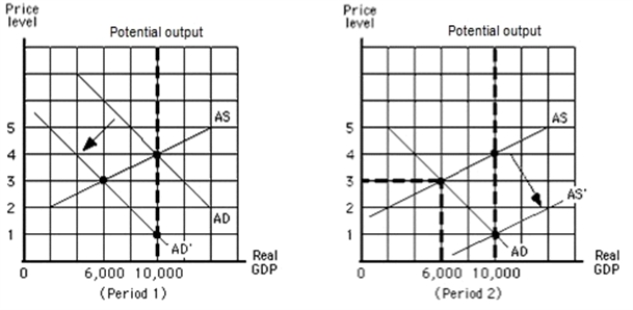
-Refer to the graphs in the exhibit.From the beginning of period 1 to the end of period 2, what happened to real GDP?
A) Real GDP decreased, and then it increased.
B) Real GDP increased, and then it decreased.
C) Real GDP fell from $10,000 to $6,000.
D) Real GDP rose from $6,000 to $10,000.
Correct Answer:
Verified
Related Questions
Q62: Q63: What does Adam Smith's "invisible hand" explain? Q64: Suppose the economy was initially in equilibrium, Q65: According to John Maynard Keynes' The General![]()

