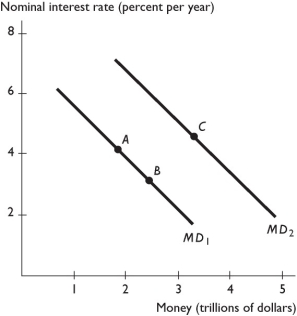
-In the above figure, a movement from point B to point C represents
A) an increase in the demand for money that might be the result of an increase in real GDP.
B) a decrease in the demand for money that might be the result of an increase in real GDP.
C) a decrease in the quantity of money demanded.
D) a increase in the quantity of money demanded.
E) an increase in the demand for money that might be the result of a fall in the price level.
Correct Answer:
Verified
Q63: In the money market, if the nominal
Q64: If credit card usage exhibits a sharp
Q65: Advances in financial technology
A) must increase the
Q66: Which of the following shifts the demand
Q67: As a result of increased use of
Q69: The supply of money curve is
A) upward
Q70: An increase in real GDP leads to
Q71: Since 1970, as a percent of GDP,
Q72: As more and more businesses accept credit
Q73: In the United States since 1970, the
Unlock this Answer For Free Now!
View this answer and more for free by performing one of the following actions

Scan the QR code to install the App and get 2 free unlocks

Unlock quizzes for free by uploading documents