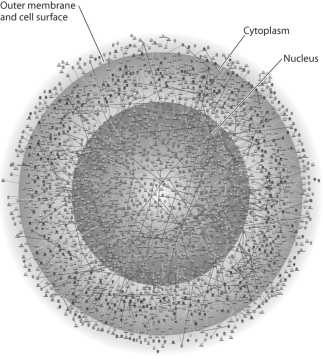
-The illustration above represents
A) a computer simulation of the structure of a eukaryotic cell.
B) a map of a network of protein interactions within a eukaryotic cell.
C) an inventory of all the genes in a fruit fly.
D) an X-ray diffraction image of the nucleus and cytoplasm of a eukaryotic cell.
E) a computer generated map of the interaction of genes and cytoplasm in a prokaryotic cell.
Correct Answer:
Verified
Q4: Which of the following types of cells
Q8: Which of the following is not a
Q9: Which of these is a correct representation
Q10: Which of the following statements concerning prokaryotic
Q12: A localized group of organisms that belong
Q14: Which of the following is a False
Q15: A type of protein critical to all
Q16: The lowest level of biological organization that
Q17: Which of the following sequences represents the
Q20: The main source of energy for producers
Unlock this Answer For Free Now!
View this answer and more for free by performing one of the following actions

Scan the QR code to install the App and get 2 free unlocks

Unlock quizzes for free by uploading documents