Multiple Choice
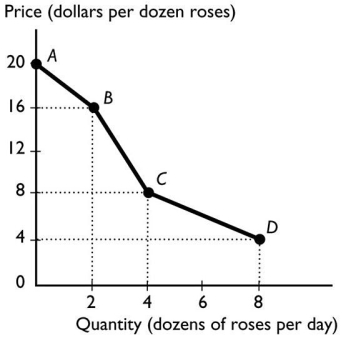
-The figure above shows the relationship between the price of a dozen roses and the quantity of roses a florist can sell.The slope between points C and D equals
A) 1.
B) 4.
C) 12.
D) 2.
E) 8.
Correct Answer:
Verified
Related Questions

