Use the figure below to answer the following questions.
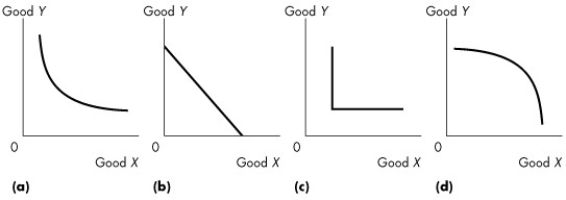
Figure 9.2.1
-Which of the graphs in Figure 9.2.1 shows perfect substitutes?
A) (a)
B) (b)
C) (c)
D) (d)
E) (c) and (d)
Correct Answer:
Verified
Q44: A rise in the price of gasoline,everything
Q45: A constant marginal rate of substitution between
Q45: What is a distinguishing characteristic of goods
Q46: The number of pizza slices is plotted
Q46: Sam buys gasoline and coffee each week.
Q47: A consumer always has a cup of
Q48: Good X is measured on the horizontal
Q51: Use the figure below to answer the
Q54: An indifference curve is
A)the boundary between what
Q56: A preference map is
A)a series of points
Unlock this Answer For Free Now!
View this answer and more for free by performing one of the following actions

Scan the QR code to install the App and get 2 free unlocks

Unlock quizzes for free by uploading documents