Use the figure below to answer the following questions.
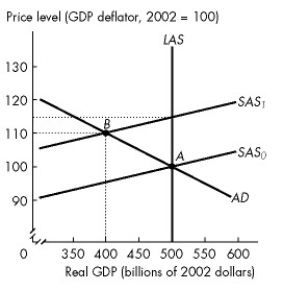
Figure 28.2.2
-Refer to Figure 28.2.2. The vertical distance between SAS₀ and SAS₁ represents the
A) actual inflation rate.
B) expected increase in real GDP.
C) actual decrease in real GDP.
D) expected inflation rate.
E) expected decrease in the real wage rate.
Correct Answer:
Verified
Q40: Inflation that starts because aggregate demand increases
Q41: Use the figure below to answer the
Q42: Use the figure below to answer the
Q43: Use the figure below to answer the
Q44: A forecast based on all the relevant
Q46: Use the figure below to answer the
Q47: An economy is in long-run equilibrium when
Q48: An increase in the price level due
Q49: Use the figure below to answer the
Q50: Use the figure below to answer the
Unlock this Answer For Free Now!
View this answer and more for free by performing one of the following actions

Scan the QR code to install the App and get 2 free unlocks

Unlock quizzes for free by uploading documents