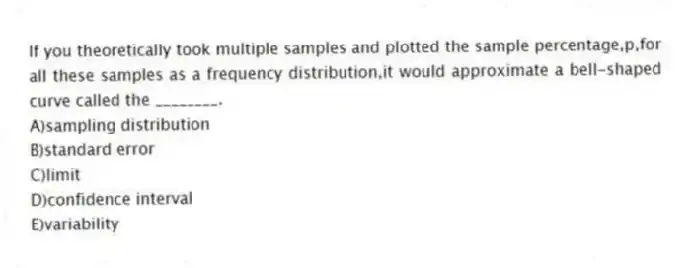
If you theoretically took multiple samples and plotted the sample percentage,p,for all these samples as a frequency distribution,it would approximate a bell-shaped curve called the ________.
A) sampling distribution
B) standard error
C) limit
D) confidence interval
E) variability
Correct Answer:
Verified
Q20: Estimating a population percentage is done when
Q21: Which of the following is NOT true
Q22: A _ is a prediction about the
Q23: If a researcher wishes to have a
Q24: The proper command sequence using your XL
Q26: When calculating the confidence interval for an
Q27: The first step in estimating a population
Q28: When computing standard error,if the sample size
Q29: Which of the following is true about
Q30: What is the first step in estimating
Unlock this Answer For Free Now!
View this answer and more for free by performing one of the following actions

Scan the QR code to install the App and get 2 free unlocks

Unlock quizzes for free by uploading documents