Multiple Choice
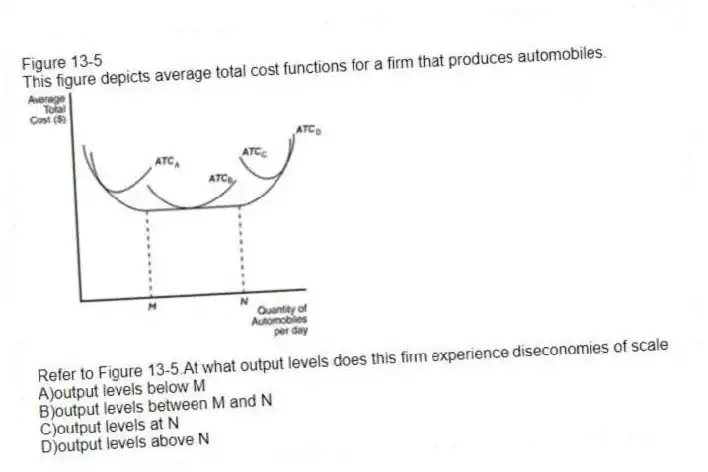
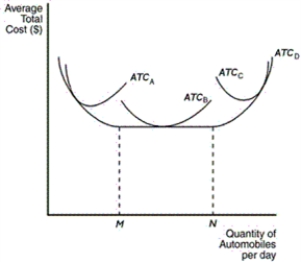
Figure 13-5
This figure depicts average total cost functions for a firm that produces automobiles.
-Refer to Figure 13-5.At what output levels does this firm experience diseconomies of scale
A) output levels below M
B) output levels between M and N
C) output levels at N
D) output levels above N
Correct Answer:
Verified
Related Questions
Q154: Table 13-6
Tom owns a factory in which
Q155: If a firm wants to capitalize on
Q156: What is the fundamental reason that marginal
Q157: What is the length of the short
Unlock this Answer For Free Now!
View this answer and more for free by performing one of the following actions

Scan the QR code to install the App and get 2 free unlocks

Unlock quizzes for free by uploading documents