Multiple Choice
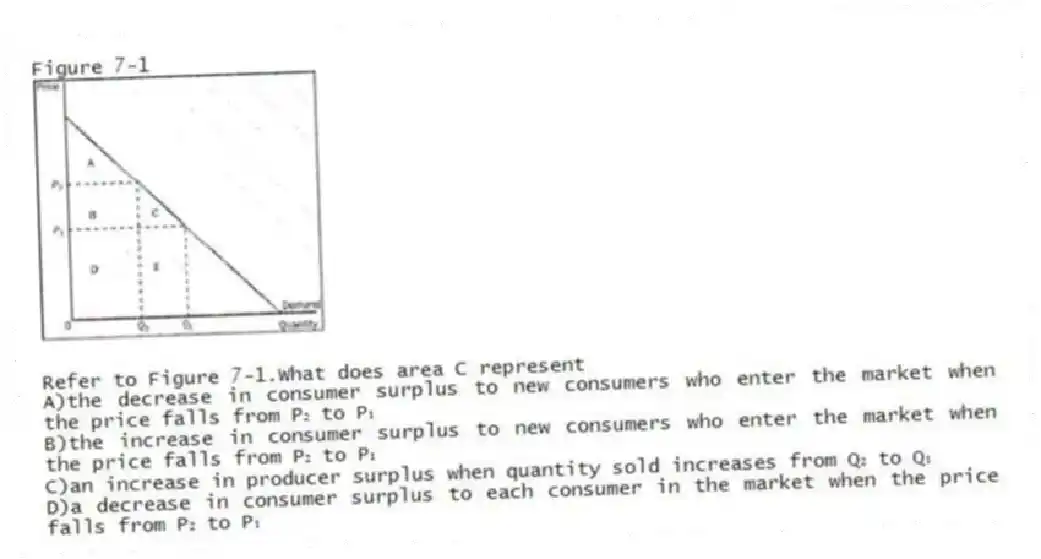
Figure 7-1
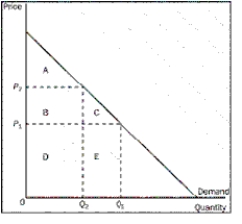
-Refer to Figure 7-1.What does area C represent
A) the decrease in consumer surplus to new consumers who enter the market when the price falls from P₂ to P₁
B) the increase in consumer surplus to new consumers who enter the market when the price falls from P₂ to P₁
C) an increase in producer surplus when quantity sold increases from Q₂ to Q₁
D) a decrease in consumer surplus to each consumer in the market when the price falls from P₂ to P₁
Correct Answer:
Verified
Related Questions
Q52: Other things equal,if the price of a
Q53: Figure 7-1 Q54: What will occur when the price of Q55: If the cost of producing sectional sofas
![]()

