Multiple Choice

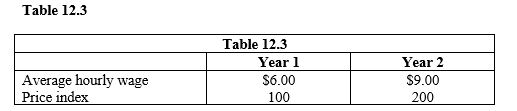
-The data in Table 12.3 suggest that, in year 2, aggregate
A) demand increases.
B) demand decreases.
C) supply decreases.
D) supply increases.
E) supply remains constant.
Correct Answer:
Verified
Related Questions
Q62: The short-run aggregate supply curve shifts to
Q63: Q64: Figure 12.2 Q65: In the 1970s, the world price of Q66: Q68: To determine short-run equilibrium in the economy, Q69: Figure 12.2 Q70: Which of the following statements is true? Q71: Figure 12.2 Q72: In the mid-2000s, the price of oil Unlock this Answer For Free Now! View this answer and more for free by performing one of the following actions Scan the QR code to install the App and get 2 free unlocks Unlock quizzes for free by uploading documents![]()
![]()
![]()
![]()
A)
![]()

