Essay
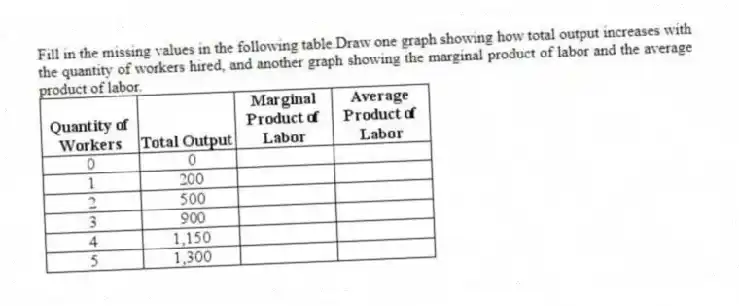
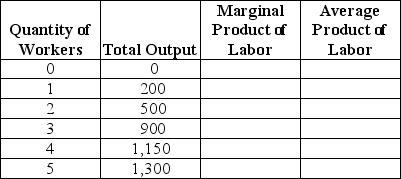
Fill in the missing values in the following table.Draw one graph showing how total output increases with the quantity of workers hired, and another graph showing the marginal product of labor and the average product of labor.
Correct Answer:
Verified
Related Questions
Q142: If the 15th unit of output has
Q143: Marginal cost is calculated for a particular
Q144: When the marginal product of labor rises,
A)the
Unlock this Answer For Free Now!
View this answer and more for free by performing one of the following actions

Scan the QR code to install the App and get 2 free unlocks

Unlock quizzes for free by uploading documents