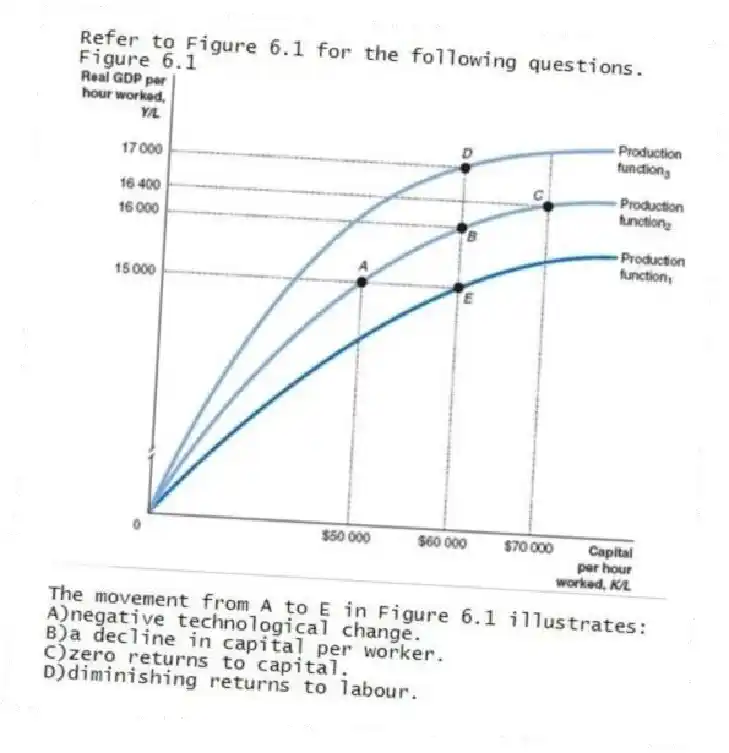
Refer to Figure 6.1 for the following questions.
Figure 6.1
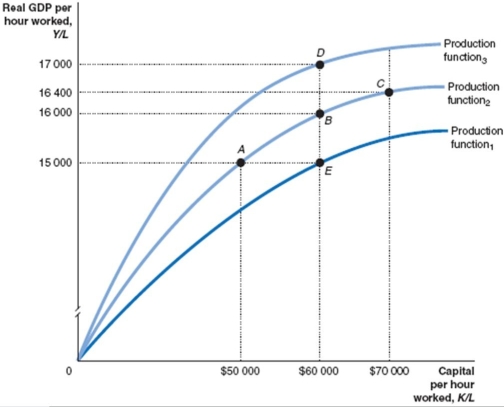
-The movement from A to E in Figure 6.1 illustrates:
A) negative technological change.
B) a decline in capital per worker.
C) zero returns to capital.
D) diminishing returns to labour.
Correct Answer:
Verified
Q19: During which of the following periods was
Q20: Refer to Table 6.1 for the following
Q21: Labour productivity can be explained by:
A)technological change
Q22: Refer to Figure 6.1 for the following
Q23: An increase in _ shifts _ the
Q26: Refer to Figure 6.1 for the following
Q29: What are the three common ways of
Q46: How do economic growth rates affect a
Q90: If the per-worker production function shifts up
A)it
Q115: According to new growth theory,the accumulation of
Unlock this Answer For Free Now!
View this answer and more for free by performing one of the following actions

Scan the QR code to install the App and get 2 free unlocks

Unlock quizzes for free by uploading documents