Use the following
November 6, 2012 was election day. Many of the major television networks aired coverage of the incoming election results during the primetime hours. The provided boxplot displays the amount of time (in minutes) spent watching election coverage for a random sample of 25 U.S. adults. In this sample, the average time spent watching election coverage was 80.44 minutes with standard deviation of 43.99 minutes.
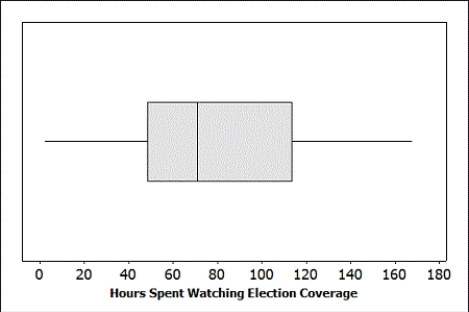
-Construct a 90% confidence interval for the average amount of time U.S. adults spent watching election coverage. Use two decimal places in your margin of error.
Correct Answer:
Verified
80.44
View Answer
Unlock this answer now
Get Access to more Verified Answers free of charge
Q53: Use the following
A dotplot and the summary
Q54: Use the following
A dotplot and the summary
Q55: Use the following
A dotplot and the summary
Q56: Use the following
A dotplot and the summary
Q57: Use the following
November 6, 2012 was election
Q59: Use the following
November 6, 2012 was election
Q60: Use the following
November 6, 2012 was election
Q61: Use the following
Turkey is a staple
Q62: Use the following
Turkey is a staple
Q63: Use the following
Turkey is a staple
Unlock this Answer For Free Now!
View this answer and more for free by performing one of the following actions

Scan the QR code to install the App and get 2 free unlocks

Unlock quizzes for free by uploading documents